Azure Troubleshooting Agent
I designed the first version of Azure Copilot's Kubernetes Troubleshooting Agent. It investigates AKS issues, shows the evidence it gathered, and asks for review before anything changes.
Problem
Troubleshooting a Kubernetes issue required engineers to correlate commands, events, configuration, logs, and monitoring data across several tools.
Vision
Let the agent do the digging, but show its work: what it checked, what it found, and what it wants to do next.
Impact
The experience launched in preview, and 90% of daily users returned. In prototype tests, participants knew what needed attention and what to do next.
One Kubernetes issue could send an engineer across five tools.
A failing workload might involve nodes, networking, configuration, events, or metrics. Engineers often had to piece the answer together across the portal, dashboards, kubectl, and documentation.
- Resource state
- Commands
- Events
- Configuration
- Monitoring
The hard part was not finding data. It was connecting evidence spread across tools.
The interaction model separates investigation from action.
We drew a hard line between investigation and action. The agent could gather evidence and form a diagnosis on its own, but any change to a resource stayed visible and required explicit confirmation.
- Gather evidence
- Analyze findings
- Propose a change
- Engineer reviews
- Explicit confirmation
The agent could investigate on its own. The engineer still decided whether anything changed.
The agent begins with the current cluster and issue in scope.
Starting from a cluster page gave the agent the selected resource and issue up front. That cut setup and made the investigation scope obvious before the first command ran.
Opening Copilot from a cluster page carries that cluster into the investigation.
Progress remains visible while the agent investigates.
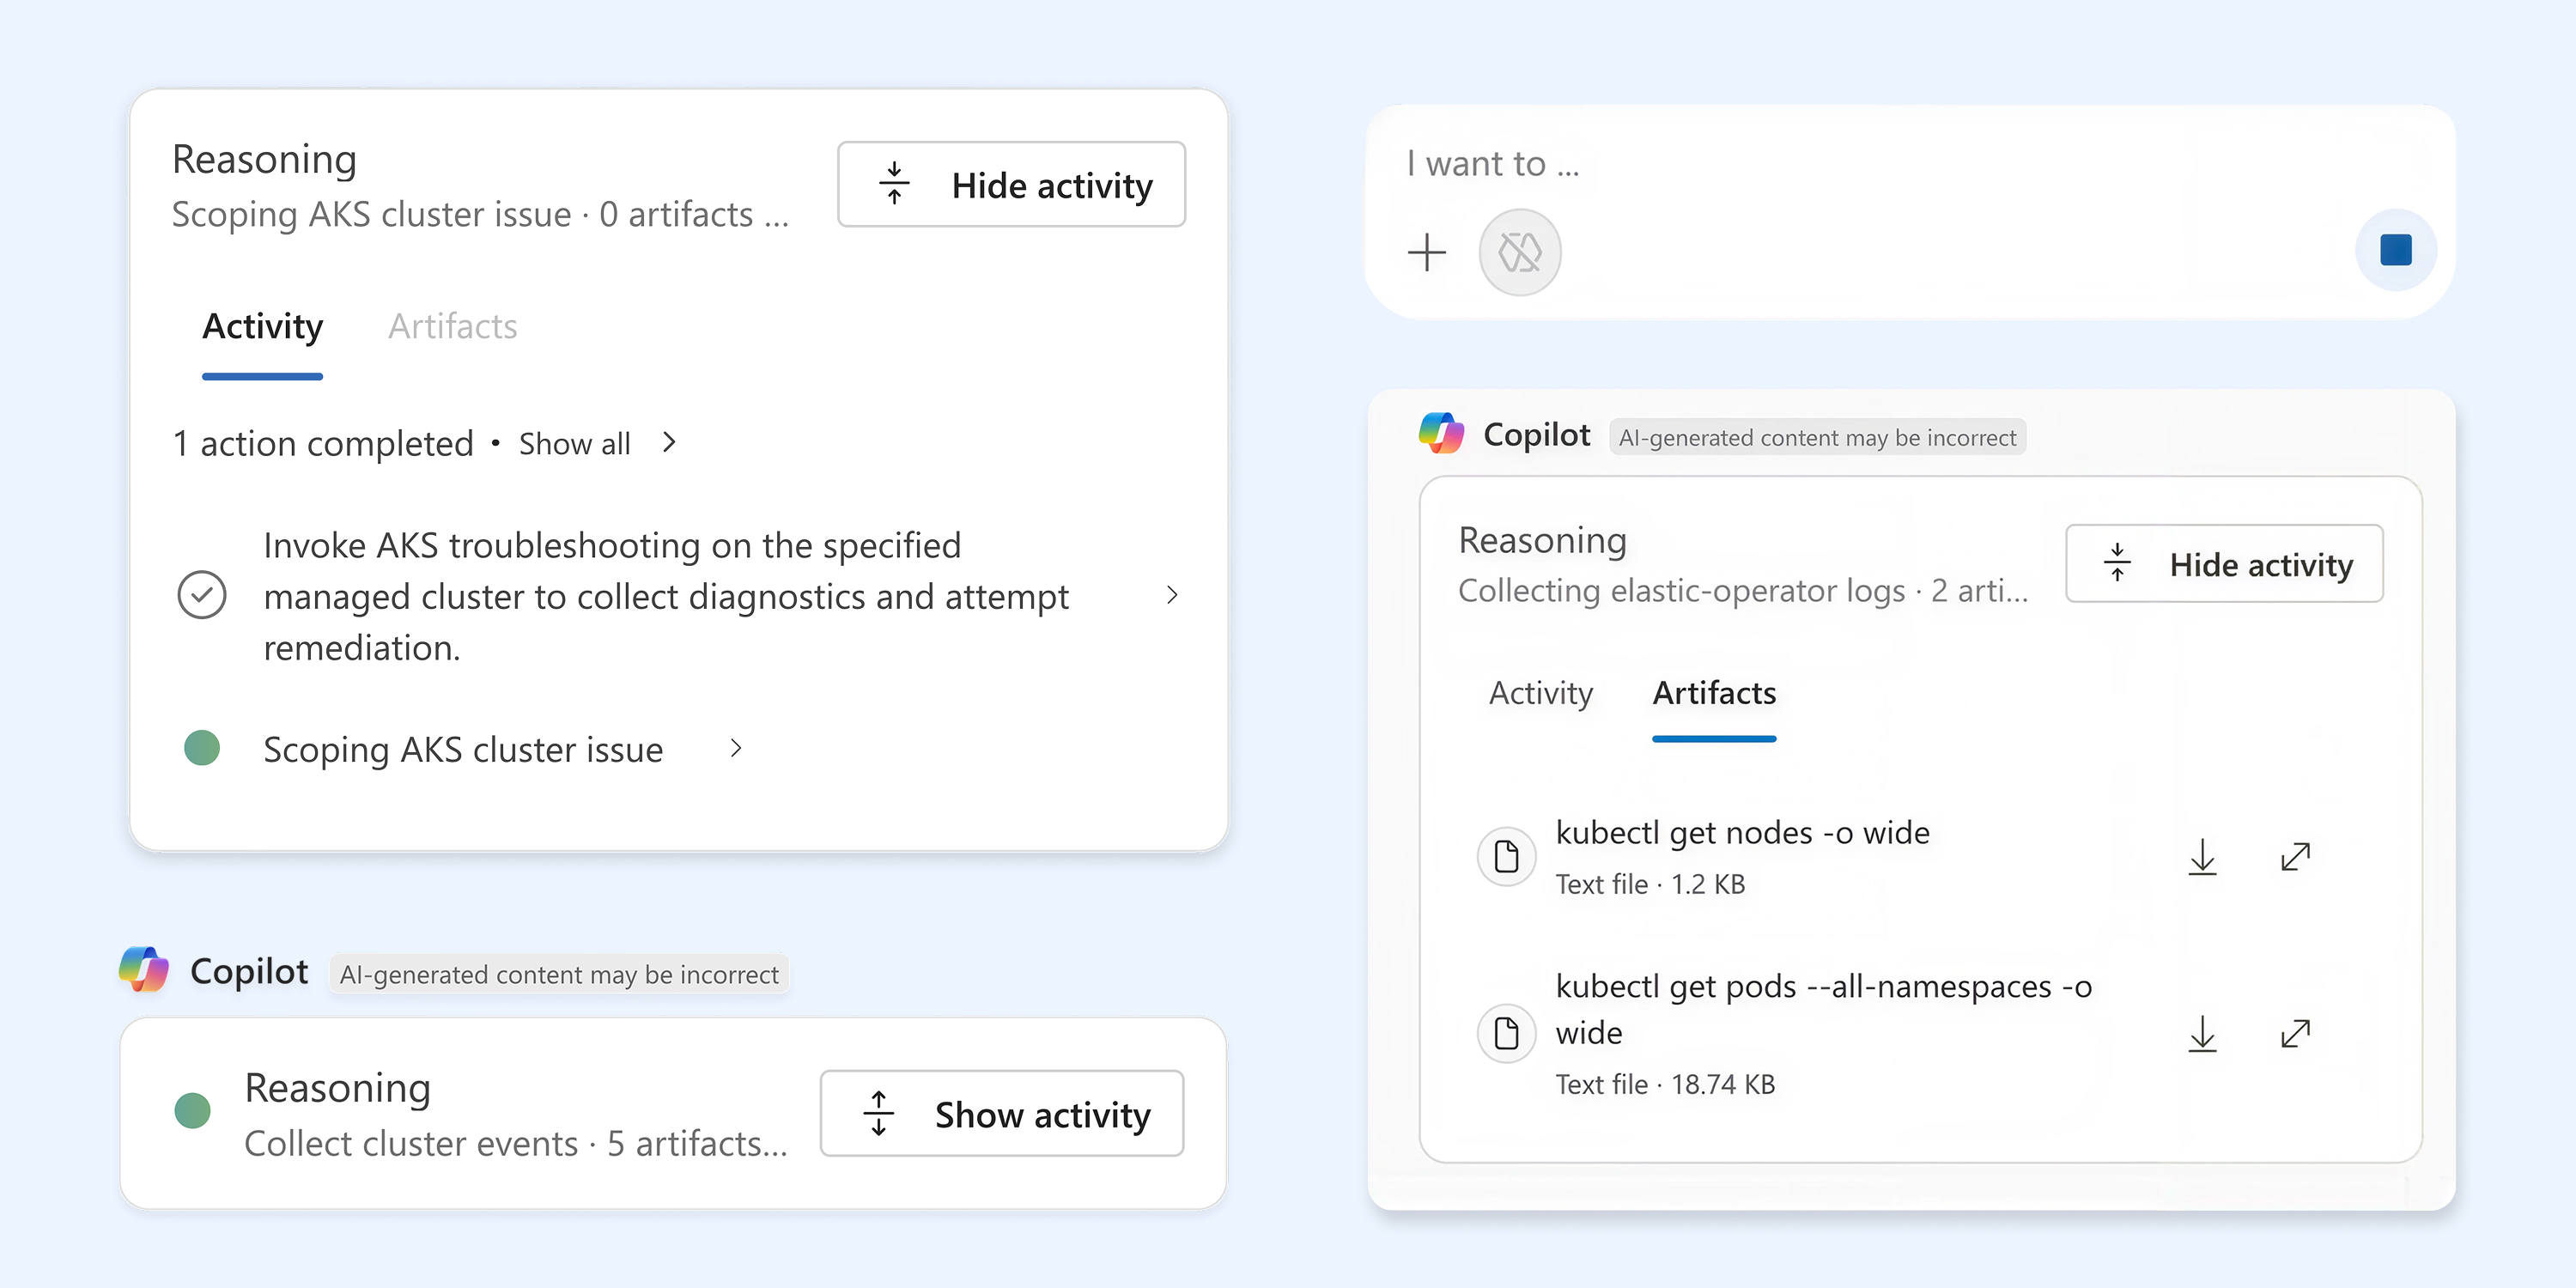
As the agent worked, it grouped commands, events, metrics, and configuration into readable steps. Engineers could follow the investigation and open the raw artifacts behind any step.
The activity panel shows each check, the evidence it collected, and the cause the agent reached.
The result connects diagnosis, evidence, and a controlled next step.
At the end, the agent named the likely cause, showed the evidence behind it, and suggested a next step. If that step changed a resource, the engineer had to review and confirm it first.
The agent moved faster without becoming a black box.
Prototype participants could tell what needed attention and understood the recommended next step. After preview launch, 90% of daily users returned. The clearest lesson was that visibility and control mattered as much as speed.
Speed was never the hard part of an agentic tool.
People did not trust the agent because it was fast. They trusted it because they could see the investigation and approve any change before it happened.
Azure OpenAI for Developers
Helping developers get started with AI by doing, not just reading.